
This has nothing to do with QA, but I’ve been writing a lot of BIRT reports lately; I just solved this problem and wanted to make sure my solution is out there for others who need it.
This is the stacked bar chart that I created:
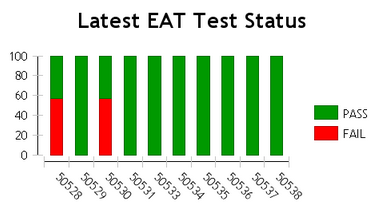
There are three possible values: PASS, FAIL and NOTRUN, and I wanted to make sure that each value got a specified color: green for PASS, red for FAIL and grey for NOTRUN (not tests showed this value on the chart that I used for this post)
The solution was to select the chart, click on the ‘Script’ tab and enter the code below. The beforeDrawDataPoint function draws the bars. the beforeDrawLegendItem function draws the legend:
/**

* Called before drawing each datapoint graphical representation or marker.

*

* @param dph

*            DataPointHints

* @param fill

*            Fill

* @param icsc

*            IChartScriptContext

*/

function beforeDrawDataPoint( dph, fill, icsc )

{

var Condition = dph.getSeriesDisplayValue();

if(Condition == "PASS")   {fill.set(0,153,0);}

if(Condition == "FAIL")   {fill.set(255,0,0);}

if(Condition == "NOTRUN") {fill.set(204,204,204);}

}

/**

* Called before drawing the legend item.

*

* @param lerh

* 			  LegendEntryRenderingHints

* @param bounds

* 			  Bounds

* @param icsc

* 			  IChartScriptContext

* @since Version 2.2.0

*/

function beforeDrawLegendItem( lerh, bounds, icsc )

{

var Condition = lerh.getLabel().getCaption().getValue();

if(Condition == "PASS") { lerh.getFill().set(0,153,0);}

if(Condition == "FAIL") { lerh.getFill().set(255,0,0);}

if(Condition == "NOTRUN") { lerh.getFill().set(204,204,204);}

}